We hope our experiences implementing GIS might prove beneficial to your own endeavours.
Here are some of the tactics and strategies we are employing to managing our GIS implementation at the Town of Orangeville. Using these methods, we are striving for efficiency and effectiveness in deployment and utilization. We are also making our strategies open so that you might employ them for your organization. If you do, let us know! We would love to learn with you...
ArcGIS Online Thumbnails
Summary
If you manage an ArcGIS Online Organization then you know how tedious it can be to create good information for every item (layer, map, app, etc) that is created. There are summaries, tags, descriptions, attributions, etc... we can't help you with those, but at least we have standardized and streamlined those item images that show up everywhere on ArcGIS Online, simply by setting up an organized template in Illustrator.
There are a number of posts that describe the issue in detail. We recommend Put your best thumbnail forward from the Esri Blog and MapIT Greater Sudbury review on their thumbnail strategy.
What We Did
Our Adobe Illustrator template uses font awesome icons which you can download and install for free. There are many free vector icon packs out there, if you prefer something different!
Instead of creating somewhat arbitrary categories for our data, we decided to classify our items using the ISO 19115 topic categories, which is the same strategy we use for our geodatabase layers.
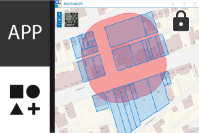
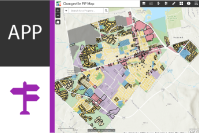
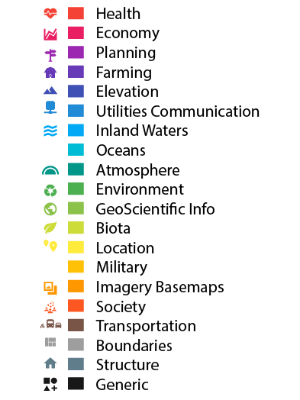
Using similar methodologies out there, our thumbnail is sectioned into an item type (top left), an image preview (right), and an icon and colour scheme (bottom left). We also put an option for a lock in the (top right) to indicate private items.
Watch the video to see how easy it is to repeat this icon over and over for each of your items, and download the template or create your own.
But Why
To save time and create consistency with the look of our ArcGIS Online item thumbnails.
attachment Illustrator Template videocam Instructional Video
Project Sources:
Font Awesome Icons
YouTube Thumbnails
Summary
When we started creating help videos, informational videos, and demo videos for YouTube, we applied the same technique we have been using for our ArcGIS Online Thumbnails.
What We Did
Our Adobe Illustrator template uses font awesome icons which you can download and install for free. There are many free vector icon packs out there, if you prefer something different!
We decided that there are 3 types of videos we plan to create, however additional types can be added later if needed.



We created a template with interchangeable parts similar to the ArcGIS Online Thumbnails. Video type (top left), icon and colour scheme (bottom left), a simple text title / description in the main area (right), and the Data Orangeville logo (top right).
But Why
To save time and create consistency with the look of our YouTube videos.
attachment Illustrator Template videocam Instructional Video
Project Sources:
Font Awesome Icons
Development Charges Lookup and Calculator
Summary
Development Charges are applied to new buildings and generally recuperate some of the cost of infrastructure that the new building will be connected to. The costs are dependent on where the building is in relation to multiple overlapping infrastructure projects zones. After the "where" is answered by a web map, the relative zones are carried to an html pager that serves as a cost calculator and invoice/receipt.
What We Did
After determining where our development charge zones are, we created an ArcGIS Online web app using the Information Lookup template.
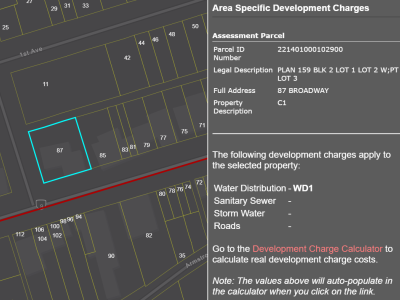
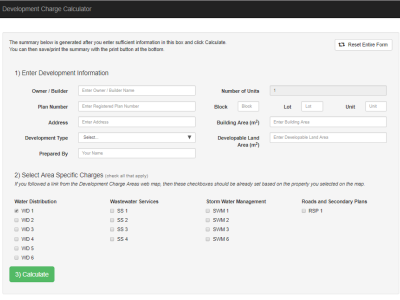
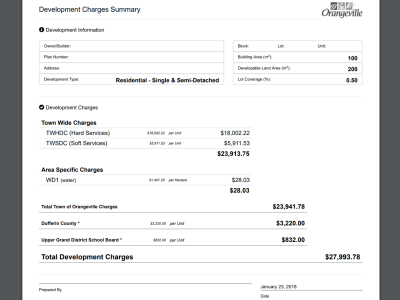
This app allows us to search (or click on) a property and get a single organized result that tells us what development charges apply to the given property. More importantly, there is a custom link that embeds the results so that the calculator page can know which charges to apply when it is loaded. After entering a few key fields into the form, you click the 'Calculate' button to generate a cost summary for the property. This can be used as a quick quote, or as an invoice/receipt if approved by the Town.
But Why
Plagued with poor reference maps, and manual calculations. The implementation of a web app and an html calculator allows massive time savings with a reduction of potential errors due to significant automation. Where this process sometimes took hours to complete, now a quick quote can now be spun up in a minute.
attachment HTML Template videocam Showcase Video
Project Sources:
ArcGIS Online - Information Lookup Template
Bare Bootstrap Template released under the MIT License (use it however for free, share with the same licence)
CurrencyFormatter.js released under the MIT License (use it however for free, share with the same licence)
Public Streetlight Reporting
Summary
Orangeville Hydro does not conduct regular rounds to look for malfunctioning streetlights. Sure, if they come across an issue they will fix it, but it is much simpler if we can enable anyone to quickly report a problem. The main issue here is effectively conveying which exact light is out... but we have got that covered!
What We Did
Orangeville Hydro is using a mobile and cloud based data collection method for updating streetlight records. We have plugged into this live data stream and made a very simple ArcGIS Online app with a few attributes included. At the very least, this map shows the locations of streetlights and the progress of LED conversion. Every streetlight also has a reporting link, when clicked on, opens a form with the specific streetlight ID auto-populated. Just complete your name, email, and a message (ie "It done broke itself"). The form sends an email directly to Orangeville Hydro to begin processing the issue.
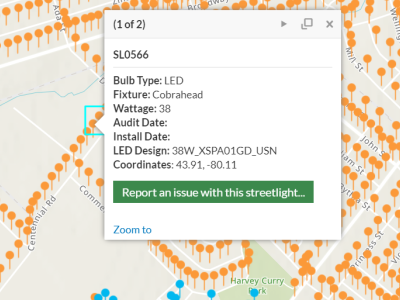
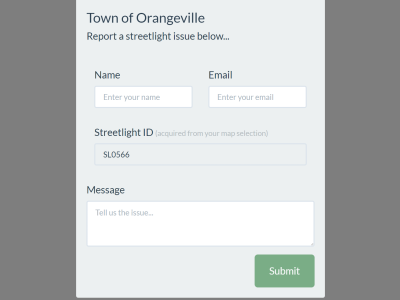
The map is very simple to create with just streetlights data and a custom popup that has a link to the email form with the streetlight ID as a url parameter, and the email form is a simple html page with an email form that utilizes the streetlight ID written into the url parameter.
But Why
In addition to a common reporting hotline we've also released this online means of reporting streetlight issues, and it only takes seconds for anyone complete. Also, by selecting a streetlight on the map we know exactly which light is being referring to.
attachment Email Form Template videocam Showcase Video
Project Sources:
ArcGIS Online - Public Information Template
EnvatoTuts+ - Building a Bootstrap Contact Form Using PHP and AJAX
Tree Sculptures - Custom Map Tour
Summary
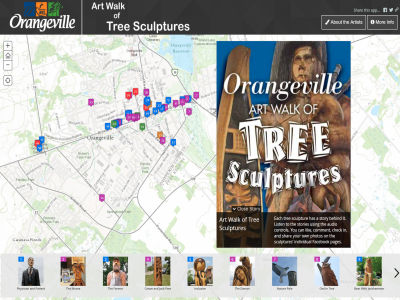
The Town of Orangeville has a great program of tree sculptures that are placed around town. There is a nice hard copy brochure of these tree sculptures. However a digital version of the same is not only complimentary but updated regularly instead of being altered and printed annually.
What We Did
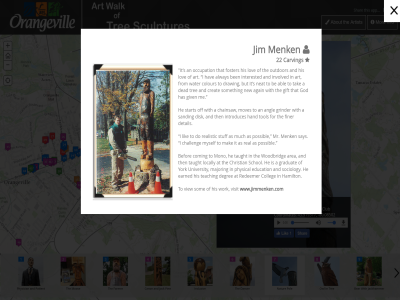
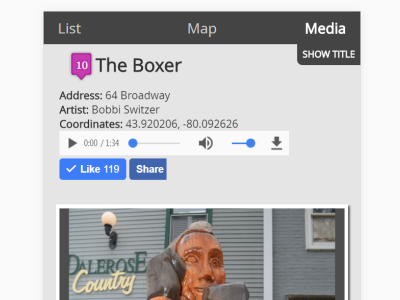
Taking the Esri 'Map Tour' Story Map template, we customized it to include several bonus features, including audio recordings, facebook like and share buttons, more information about the contributors, and alternate links.
But Why
This effort was to provide the great information we have on our tree sculptures program in a digital format to compliment the hardcopy brochure. The customizations add a little bit more of a social interaction to allow the public to contribute and be a part of the sculptures' online presence.
attachment Custom Map Tour Template videocam Showcase Video
Project Sources:
Esri - Map Tour Template released under the Apache License – 2.0
Park Locator App Config
Summary
This is simply a package of icons and some code to make your Esri Park Locator app implementation a little better. See our Parks Locator App.
What We Did
Setting up the Parks Locator app is fairly straight forward, and it has plenty of documentation to get you up and running. Additional steps were made to the configuration to increase the number of icons available for our park features, and have the park features shown not only within in the widget pane, but also in the popoup on the map.
We started with the adobe illustrator file available from the NPS and created a few additional icons, available in the Park Locator Config Package you can download below. This is because there always seems to be icons missing for exactly what you require. Here is our final set of park feature icons.
After the icons are in order and the map is setup per the default configuration, we altered the configuration of the arcgis online map a little bit further.
We did this by going to the popup configuration of the parks layer. Here you will create an single expression per feature in your dataset. Rename the expression titles for organization.
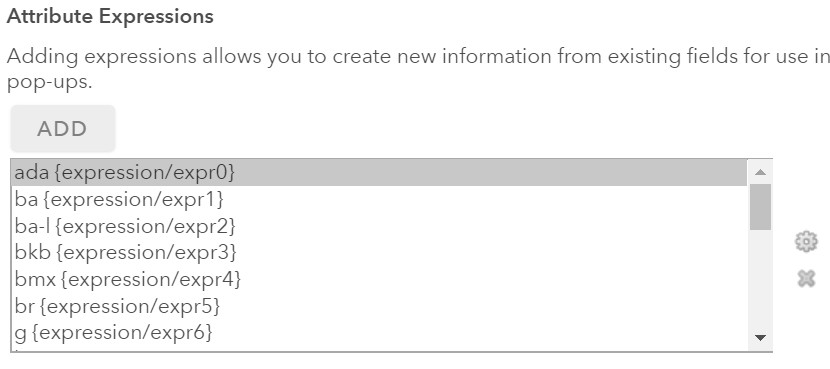
This is what the first 4 expressions look like. The idea is if the feature is set to 'Yes' then show the image, otherwise set display:none to hide the image.
IIF($feature.ADACOMPLY == 'Yes', 'inherit', 'none');
IIF($feature.BASEBALL == 'Yes', 'inherit', 'none');
IIF($feature.BASEBALLLIT == 'Yes', 'inherit', 'none');
IIF($feature.BASKETBALL == 'Yes', 'inherit', 'none');
Once you have all of your expressions ready, we can adjust the custom popup contents.
Open the custom popup configuration window and make sure you enter into the code view with the "view html source" button, then copy and paste the following snippet. The first section is your normal address and contact info, followed by image tags with every feature icon available. The display of the icon is managed by the relative expression for that feature. Make sure to update the url path to your images by replacing "FULL_URL_OF_IMG".
<font face="Tahoma" size="2">
{FULLADDR}
<br /><br />
<b>Open:</b>
<br />
{OPERDAYS} | {OPERHOURS}
<br /><br />
<b>Park Facts:</b>
<br />
Size: {PARKAREA} acres
<br />
Parking: {PARKINGLOT} ({NUMPARKING} spaces)
<br /><br />
<b>Contact:</b>
<br />
Phone: 519-940-9092
<br />
Email: [email protected]
<br />
<a href="{PARKURL}">Website</a>
<br /><br />
<b>Park Features:</b>
<br /><br /><br />	</font>
<img alt="Accessibility" src="FULL_URL_OF_IMG/accessibility.png" style="float:left;padding:1px;display:{expression/expr0}" />
<img alt="Baseball Diamond" src="FULL_URL_OF_IMG/baseball.png" style="float:left;padding:1px;display:{expression/expr1}" />
<img alt="Baseball Diamond (Lit)" src="FULL_URL_OF_IMG/baseball_lit.png" style="float:left;padding:1px;display:{expression/expr2}" />
<img alt="Basketball Court" src="FULL_URL_OF_IMG/basketball.png" style="float:left;padding:1px;display:{expression/expr3}" />
<img alt="BMX Park" src="FULL_URL_OF_IMG/bmx.png" style="float:left;padding:1px;display:{expression/expr4}" />
<img alt="Bridge / Boardwalk" src="FULL_URL_OF_IMG/bridge_bdwlk.png" style="float:left;padding:1px;display:{expression/expr5}" />
<img alt="Gazebo" src="FULL_URL_OF_IMG/gazebo.png" style="float:left;padding:1px;display:{expression/expr6}" />
<img alt="Hiking" src="FULL_URL_OF_IMG/hiking.png" style="float:left;padding:1px;display:{expression/expr7}" />
<img alt="Multi-Sport Court" src="FULL_URL_OF_IMG/multi_court.png" style="float:left;padding:1px;display:{expression/expr8}" />
<img alt="Outdoor Rink" src="FULL_URL_OF_IMG/outdoor_rink.png" style="float:left;padding:1px;display:{expression/expr9}" />
<img alt="Parking Lot" src="FULL_URL_OF_IMG/parking.png" style="float:left;padding:1px;display:{expression/expr10}" />
<img alt="Picnic Tables" src="FULL_URL_OF_IMG/picnic.png" style="float:left;padding:1px;display:{expression/expr11}" />
<img alt="Picnic Shelter" src="FULL_URL_OF_IMG/picnic_shelter.png" style="float:left;padding:1px;display:{expression/expr12}" />
<img alt="Playground" src="FULL_URL_OF_IMG/playground.png" style="float:left;padding:1px;display:{expression/expr13}" />
<img alt="Playground (Accessibile)" src="FULL_URL_OF_IMG/playground_accessible.png" style="float:left;padding:1px;display:{expression/expr14}" />
<img alt="Skateboard Park" src="FULL_URL_OF_IMG/skateboard.png" style="float:left;padding:1px;display:{expression/expr15}" />
<img alt="Soccer Field" src="FULL_URL_OF_IMG/soccer.png" style="float:left;padding:1px;display:{expression/expr16}" />
<img alt="Soccer Field (Lit)" src="FULL_URL_OF_IMG/soccer_lit.png" style="float:left;padding:1px;display:{expression/expr17}" />
<img alt="Splash Pad" src="FULL_URL_OF_IMG/splash_pad.png" style="float:left;padding:1px;display:{expression/expr18}" />
<img alt="Swimming" src="FULL_URL_OF_IMG/swimming.png" style="float:left;padding:1px;display:{expression/expr19}" />
<img alt="Tennis Court" src="FULL_URL_OF_IMG/tennis.png" style="float:left;padding:1px;display:{expression/expr20}" />
<img alt="Washrooms / Changerooms" src="FULL_URL_OF_IMG/washroom.png" style="float:left;padding:1px;display:{expression/expr21}" />
<p style="clear:both;"> </p><br />
Now you should have icons in your popup window as well as in the widget!
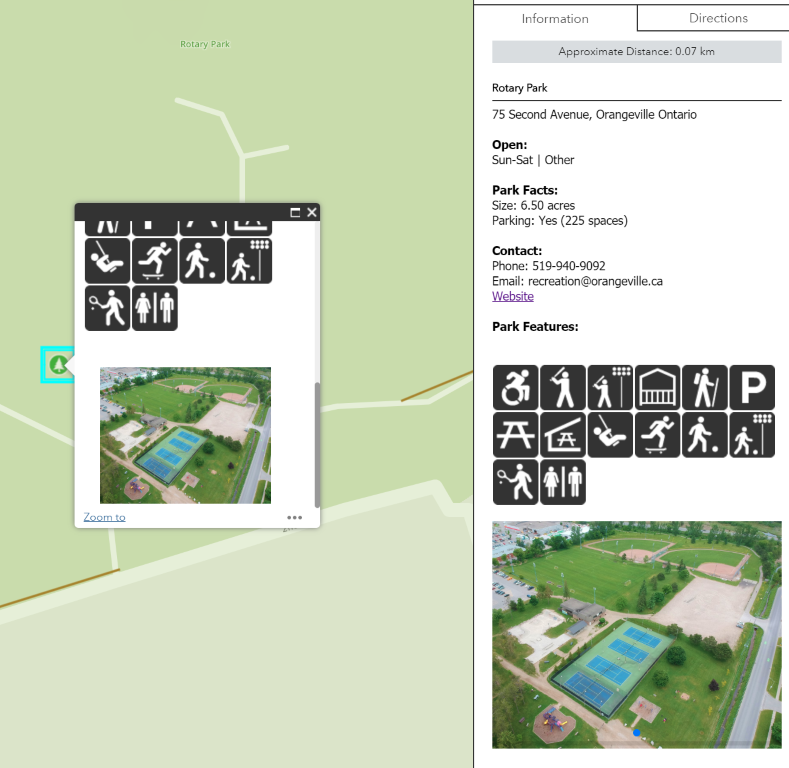
As an added bonus, get yourself a drone and take amazing images of your parks from above!
But Why
Because good icons are important and we believe this configuration improves the overall user experience.
attachment Park Locator Config Package
Project Sources:
Parks Locator
National Park Service Map Symbols
ISO Topic Categories
Summary
Establishing our first geodatabase and even data in file folders required some organization, but what rational to use?
What We Did
I was not convinced that the arbitrary naming methods I've seen used, and used myself, was sufficient. You've probably seen this kind of department based / purpose based mashup of categories that goes something like this:
- Government
- Recreation
- Transportation
- Analytics
- Planning
- Health and Safety
- Community
- etc...
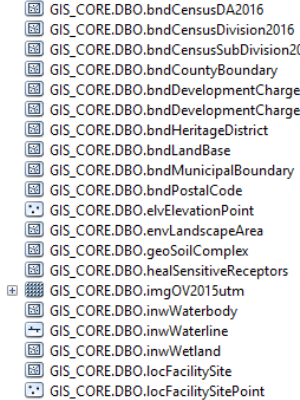
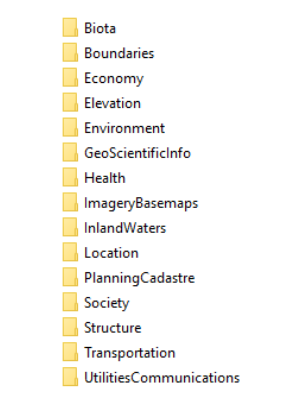
Looking for a better solution, we decided to use the ISO 19115 Topic Category. Commonly used in metadata as keywords or themes, the ISO Categories a comprehensive set for which every data, item, file, can be categorized based on what it is and not what it's purpose is. As an example, a flood plain would be categorized as 'inland water' and not 'planning' for which it is primarily used. The main reason we have come to prefer this method is because it makes everything more cohesive as if it were all Orangeville-wide Data. It is not expected that a department stay within their designated folders or items, but rather all departments are expected to navigate to the fundamental layer, item, app they require where ever it may reside. For this, a good search function is imperative.
Where exactly are these categories used?
In our Geodatabase layers, with a category prefix to all layer names
In our File Folders with non-geodatabase data
In our ArcGIS Online Thumbnails
But Why
To create consistency across the Organization. To increase awareness and familiarity of all data categories and eliminate department specific designations for data and items.
attachment ISO Topic Category ReferenceEsri CMDM Schemas
Summary
Why would you create a schema from scratch? Especially if you are not an expert on the subject matter. We assume someone has probably done it before, so why not start at least where they are.
What We Did
Many new datasets were being created in our geodatabase with a slurry of input data. The questions were always... What attributes do you need? What domains? Attachments? etc. For this reason we setup the Esri Canadian Municipal Data Model (CMDM). However, we quickly learned that the best way for us to utilize it was not to set it up and start loading our data in. But rather set it up as an empty geodatabase beside our geodatabase and simply import specific layers that we intended to use. After importing it into our geodatabase we make any alterations to the schema if necessary, and then starting loading the data. As much as we can, we try to stick to the CMDM without many alterations.
But Why
If only there were national standards on many of these layers sufficient for everyone's case, then we would all be collecting the same attributes in the same formats and we could easily merge datasets. Until then, we will try to stay as close to the CMDM as possible to stay similar to other municipalities using these schemas. With no other standard schemas available, it's the best option as far as we can say. Perhaps it's better than everyone doing their own thing.
attachment CMDM TemplateNo Map For You!
Summary
Hardcopy maps are generally more tedious to create, and create a data disconnect primarily when they are posted on walls for years on end. "Many of you feel bad for this map. That is because you crazy, it has no feelings, and the new one is much better." mood
What We Did
We essentially have an unwritten motto of 'No map for you!' mood which gets scaled back to 'hardcopy maps as a last resort'. Alternatively, we offer time-efficient ArcGIS Online maps that can be spun up quickly, and revised and altered efficiently. In our experience this takes care of almost all requests of maps that are often sought after as investigative or just a quick reference. Because we can service these types of requests in an more efficient medium we must insist, to increase the users capabilities, adoption, and to create more realistic expectations of GIS output now and in the future.
But Why
As a one GIS staff organization, there is no effective way for us to produce time consuming hardcopy maps at the rate in which they are requested. Instead we focus on solutions that are efficient and effective for larger audiences to service more people in the same time. It is my opinion that even large organizations with sufficient staffing should not service hardcopy map requests, and simple platforms can be created for users to make thier own inset maps for reports and presentations. Be strong and hang in there. mood
iPads for All
Summary
To enable field crews to manage their own data, we've started to roll out iPads.
What We Did
Starting with the Water Works group, consisting of 10 users, we've provided iPads loaded with Esri apps to view and edit water, sanitary and storm networks. We've made all point features fully editable and an additional comments point layer to comment on line work (which we deemed too inter-connected to manage effectively on the iPads) and any other issue that might require special intervention. We are in the early stages of deployment and will have better experience once we're well into it. Right now its guerrilla warfare in the mobile GIS trenches, we hope being quick to adapt to the users needs will get us through.
But Why
Let the subject matter experts manage their own data, they have the most interest in its completeness as it is their daily reference. Byproducts thereafter benefit office staff, but in the office we still have unorganized AutoCAD drawings submitted as digital plans, with little manpower to convert it digitally. So essentially, in the office, we are failing at effectively utilizing hard and soft copies of data we recieve to enlighten the corporate. Having operators dynamically managing the utility network data is a much more efficient way to get up and running efficiently with the data pouring into the organized GIS system for all to see.